.png)


The Charleston real estate market is constantly shifting, and July 2024 has been no exception. Whether you’re a homeowner, investor, or prospective buyer, understanding this month’s market data is crucial to making informed decisions. In this detailed analysis, we’ll break down the essential metrics from July 2024, including written and pending sales, mortgage rates, median prices, and more. By examining these figures closely, we’ll uncover the trends shaping the market today and what they signal for the months ahead. Stay with us as we decode July 2024’s numbers and what they mean for your next real estate move in Charleston.
Written (Pending) Sales
The first key metric to examine is written sales, also known as pending sales, which provide a snapshot of current buyer activity in the market and market momentum. We like to look at written sales instead of closed sales because they help us see current market demand. Closed sales tell us what demand was like 30-60 days ago because that is how long a transaction typically takes to close after a written contract. In July 2024, written sales across the Charleston market finished 2% lower than in July 2023, indicating a slight softening compared to last year. However, despite this year-over-year dip, the market showed resilience with 314 properties going under contract the week of August 19—a robust figure for this time of year and above the 15-year average for that week. This balance of slightly decreased annual activity with strong weekly performance suggests that while the market may be cooling slightly, there remains significant buyer interest, particularly as we move into the fall season.

Mortgage Rates
Mortgage rates have been on a steady decline, providing some relief to prospective homebuyers after the sharp increases seen last year. Since reaching their peak levels in November, rates have gradually eased, creating a more favorable borrowing environment. This downward trend is expected to continue over the next few weeks, potentially boosting buyer confidence and market activity as lower rates make home financing more accessible. With rates now well below their recent highs, this shift could help counterbalance some of the market’s cooling in other areas, keeping demand steady as we move through the latter half of the year.


Median Sale Price
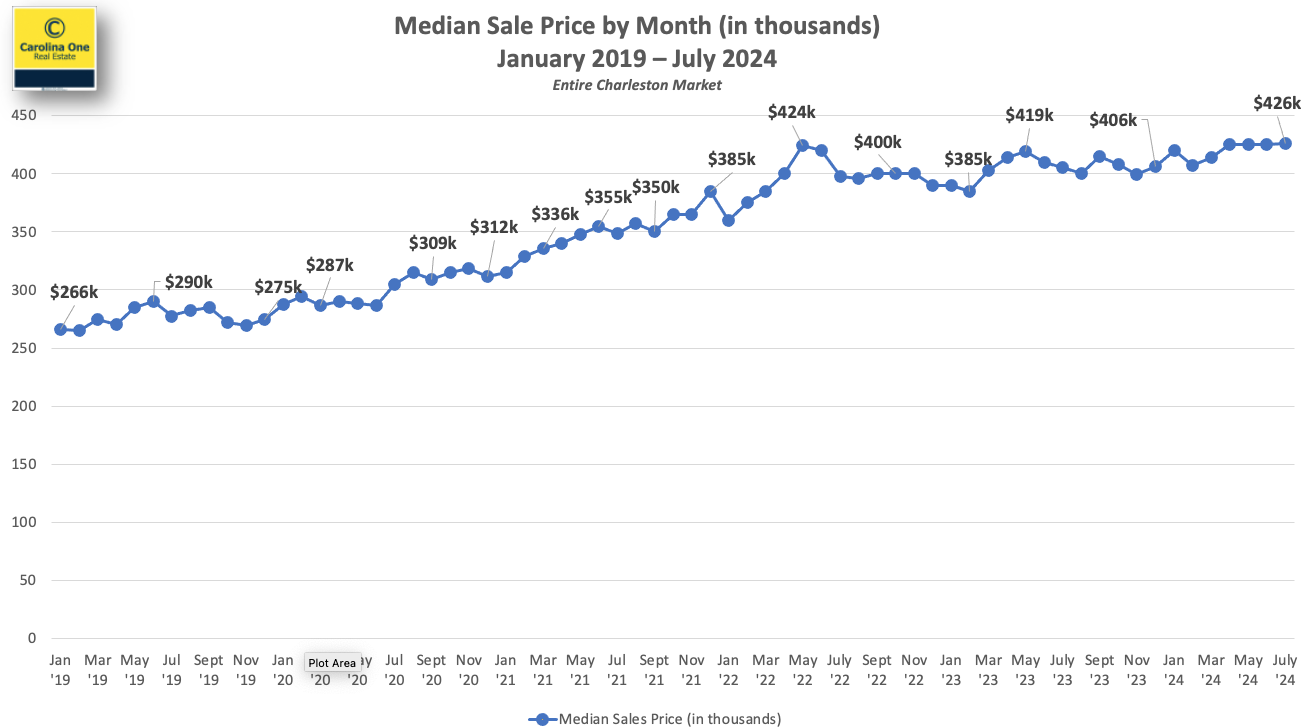
The median sale price in the Charleston real estate market has demonstrated remarkable stability over the past two years, consistently hovering between $400,000 and $425,000. In July 2024, the median sale price reached $426,000, matching the all-time high previously seen in this market. This consistent price level underscores the ongoing demand for homes in Charleston, even amid shifting market conditions, and suggests that while prices may fluctuate slightly, they remain firmly rooted within this established range. The chart below illustrates this trend, showing the median sale price trajectory since January 2019.
Average Price Per Square Foot Sold
While the median sale price in the Charleston market has remained within a stable range, the average price per square foot tells a different story. Currently sitting at an all-time high of $299 per square foot, this figure is significantly higher than it was a year ago. This suggests that while buyers may be reaching the upper limits of their budgets—reflected in the stable median sale price—they are increasingly paying more per square foot, which indicates that homes are appreciating in value. Essentially, buyers are getting less house for their money, but the value of each square foot continues to rise. This trend highlights the ongoing demand in the market and suggests that, despite some financial constraints, property values are still on an upward trajectory.

Median Sale Price Velocity
The year-over-year velocity of the median sale price reveals a robust market performance during the spring and summer months. This seasonal surge, typically the most active period for real estate, is trending 3-6% higher than last year’s levels, indicating that current pricing in the Charleston market is built on a strong foundation. With inventory remaining tight relative to demand, this upward trend suggests that further price increases could be on the horizon. However, it’s important to remember that all real estate is local. In certain submarkets, especially those with a high concentration of new construction at similar price points, price growth has been more modest. These areas, while still benefiting from overall market strength, may not experience the same rapid appreciation seen elsewhere in the region.

Active Inventory of Homes for Sale
As of the end of August, active inventory in the Charleston market stands at approximately 4,000 listings. While this represents a substantial increase from the historic low of just 1,035 listings in February 2022, it’s still far from what’s needed for a balanced market. To reach equilibrium—typically defined as five months of inventory—we would need an additional 3,900 listings market-wide. This significant gap between current inventory levels and what’s required to balance supply and demand highlights the ongoing challenges facing buyers in the market. The chart below visualizes this disparity, underscoring the continued pressure on prices and the competitive environment for available homes.

New Listings Taken
New listings taken have shown a promising increase this year, with over 2,000 new properties hitting the market in July—significantly ahead of last year’s numbers. This influx of new listings is a positive sign and could help drive sales in the latter part of the year. Over the past 12 months, a total of 23,140 new listings have been taken, compared to 20,966 in the 12-24 month period prior. This uptick in new listings suggests that more sellers are entering the market, which could help ease some of the inventory pressure and provide buyers with more options as we move forward.

Absorption Rates
The absorption rate in the Charleston metro area continues to underscore the strength of the seller’s market, with approximately nine weeks of inventory available market-wide. However, this average masks significant variation within the most active areas, where inventory levels range from just 1.4 months to 4 months. These differences create a diverse array of submarkets within the broader Charleston area, each with its own unique dynamics. Depending on the location and price point, market conditions can vary widely, offering both opportunities and challenges for buyers and sellers alike. Understanding these localized trends is crucial for navigating the Charleston real estate market effectively.

New Construction
New construction continues to play a significant role in the Charleston real estate market, accounting for 45% of all pending contracts in the MLS and roughly 36% of recent closings. It’s important to note that pending contracts for new homes often outnumber closings because new construction properties typically remain in pending status longer than resales, causing them to accumulate in this phase. As a result, while new homes currently represent about 33% of the sales market, they are a substantial portion of the market’s activity. Additionally, new construction makes up 28% of the available inventory, highlighting its importance in meeting buyer demand and shaping the overall market landscape. New construction continues to remain a solid option for many buyers, with ample inventory available (unlike many parts of the resale market) as well as many builders continuing to run incentives around closing costs and interest rates. I'll do a deep dive into the new construction market in another blog later this week.
Foreclosures
Foreclosures and short sales remain an exceptionally small part of the Charleston real estate market, currently making up just 0.9% of all available listings—down significantly from 1.8% at the beginning of 2020. The market for distressed properties is virtually nonexistent, with very few newly distressed homes entering the pipeline. This stability is largely driven by record levels of home equity and strong employment figures. Unlike during the Great Recession, homeowners today are less inclined to walk away from their properties, as they can leverage their equity to avoid foreclosure. Sellers who find themselves on the brink of financial distress can often sell their homes and cash out on the substantial equity they’ve built over the past few years, further reducing the likelihood of foreclosures in the current market.
Million Dollar Listings
The market for properties selling over $1 million has seen significant growth, maintaining sales levels that are roughly double those seen before the pandemic. This segment remains surprisingly robust, driven not only by strong demand but also by the record appreciation of home values since 2020. Many properties that once would have been priced well below the $1 million mark have now entered this luxury tier due to the rapid rise in home prices over the past few years. As a result, homes that previously wouldn’t have qualified as luxury are now commanding higher prices, expanding the pool of properties in this segment. This shift has been fueled by a combination of factors, including the influx of affluent buyers, the appeal of Charleston’s premium real estate, and the desire for more space and amenities in a post-pandemic world. The result is a high-end market that not only remains strong but continues to grow as more properties cross the $1 million threshold.
Final Thoughts
In summary, the Charleston real estate market remains dynamic and competitive, with steady median prices, rising price per square foot, and robust demand in the high-end segment. While inventory is slowly increasing, it’s still far from balanced, keeping pressure on prices. The continued strength in new construction and the low foreclosure rates further highlight the resilience of this market. If you’re looking to buy, sell, or invest, now is the time to act. Click here to schedule a call with me to discuss how we can achieve your real estate goals together.
Curious about your home's value and what's happening in your neighborhood?
Get in touch. National numbers are a great measuring stick to see how the overall economy and housing market are doing, but they don’t account for local home values and your personal financial situation.